Example using vessel encoded pCASL data
This example shows how to process vessel encoded pCASL data with OXASL.
Obtaining and installing VEASL
Vessel encoded ASL can only be processed when the VEASL tool for
vessel decoding is installed. Currently we are not able to distribute
this tool publically, so if you are interested in processing VEPCASL data
please contact Michael Chappell (michael.chappell@nottingham.ac.uk) to obtain
a copy of the VEASL code.
VEASL must be installed in your path. The ideal installation locations are either:
$FSLDIR/binif you have access to$FSLDIR$FSLDEVDIR/binif you have defined$FSLDEVDIR- Anywhere else in your default
$PATH
Running OXASL on VE data
The key distinction between running VE data and regular ASL data is the --iaf option.
This should be set to one of:
--iaf=vefor raw VEPCASL data--iaf=vedifffor VEPCASL data which has undergone pairwise subtraction
In addition the following option must be provided for VE data:
--veslocs=<vessel locations file>
The vessel locations file defines the initial locations for the encoded vessels - the first row gives the X co-ordinates, the second row the Y co-ordinates. For example this data defines 4 source vessels:
-25  25 -25  25
-13 -13 -24 -25
The encoding sequence is currently assumed to be determined from the estimated initial vessel locations.
An example command line for multi-PLD VEPCASL data would be:
oxasl -i mpld_asltc --casl --iaf=ve --ibf=tis --slicedt=0.0452 \
      --plds=0.25,0.5,0.75,1.0,1.25,1.5 --bolus=1.4 \
      --veslocs=veslocs.txt \
      -o oxasl_out
Other standard OXASL options can also be used to enable calibration, provide structural data, or apply preprocessing corrections to the data.
Pairwise subtracted VE data
By using --iaf=vediff it is possible to process pairwise-subtracted VE data. In general
it is better to use the raw data, however some preprocessing strategies, such as denoising,
may be better applied to subtracted data, where the static signal has been removed. It
is probably not a good idea to apply motion correction in this case as the subtracted images
may only show signal in parts of the brain. Do motion correction prior to subtraction instead.
Additional common VE options
--nfpc=<Number of flows per class>
VEASL can model the fact that each voxel may be fed by more than one vessel. A combination of feeder vessels is called a class. This option defines the number of vessels per class. The default value is 2.
--infer-loc=none|xy|rigid
This option controls how the locations of the vessels are inferred. none means they
are fixed at their initial positions, xy means the X/Y co-ordinates are allowed to
vary, and rigid infers a rigid body transformation of the co-ordinates. The default
is rigid.
--init-loc
This option applies to multi-PLD data only. If specified an initial decoding run is
performed on the mean across all PLDs to determine vessel locations. By default these
vessel locations are then fixed when performing the vessel decoding on the individual
PLDs. It is possible to initialize the vessel locations on the mean data and also
infer them for each PLD using --init-loc together with the
--infer-loc-pld=none|xy|rigid option.
The log output
The command line output is similar to the non-VE case, however there is an additional vessel decoding step between the preprocessing and the kinetic model inversion, which will look something like this (showing 1 PLD only):
Performing vessel decoding
- Initial vessel locations:
X: [-25.  25. -25.  25.]
Y: [-13. -13. -24. -25.]

- Encoding matrix:
TWO
0.0, 0.0, 0.0, 0.0
0.0, 1.0, 0.0, 0.0
90.0, 2.0, -25.0, 25.0
90.0, 3.0, -25.0, 25.0
0.0, 2.0, -13.0, -24.5
0.0, 3.0, -13.0, -24.5
13.495733280795811, 2.0, -18.475358737629833, -7.29290476485388
13.495733280795811, 3.0, -18.475358737629833, -7.29290476485388
MAC:
0.0, 50.0, -0.0, -0.0, -3.0068078634963786, -0.3971255668768797
0.0, 8.974483684827054e-08, -18.75, -7.25, -12.52836611276087, -1.6546898639495466
0.0, 0.0, 270.0, 270.0, 76.5042667192042, 76.5042667192042
25.0, 25.0, 5.75, 5.75, 5.591226986387976, 5.591226986387976

- Fitting PLD 1
- Vessel locations (inference: rigid):
    X: [-24.36777377  25.63201797 -24.39952284  25.59738261]
    Y: [-14.52208469 -14.66639867 -25.52203887 -26.66634868]
    Translation: 0.616, -1.59  Rotation: -0.165 (degrees)
- Class proportions:
    [0.46011736 0.06254921 0.04755664 0.03730842 0.07797115 0.31449723]

DONE vessel decoding
The subsequent kinetic model inversion will then be performed on each vessel individually marked by the log messages:
Processing per-vessel decoded images

- Processing vessel 1
...etc
After each vessel has been individually model fitted, the output is combined for all vessels:
Generating combined images for all vessels
Output images
The output images are as usual found in the oxasl_out/output directory, however there is an additional
layer not present for non-VE data. The all_vessels subdirectory contains the output for all vessels
combined, while the vessel<n> directories contain the individual vessel outputs.
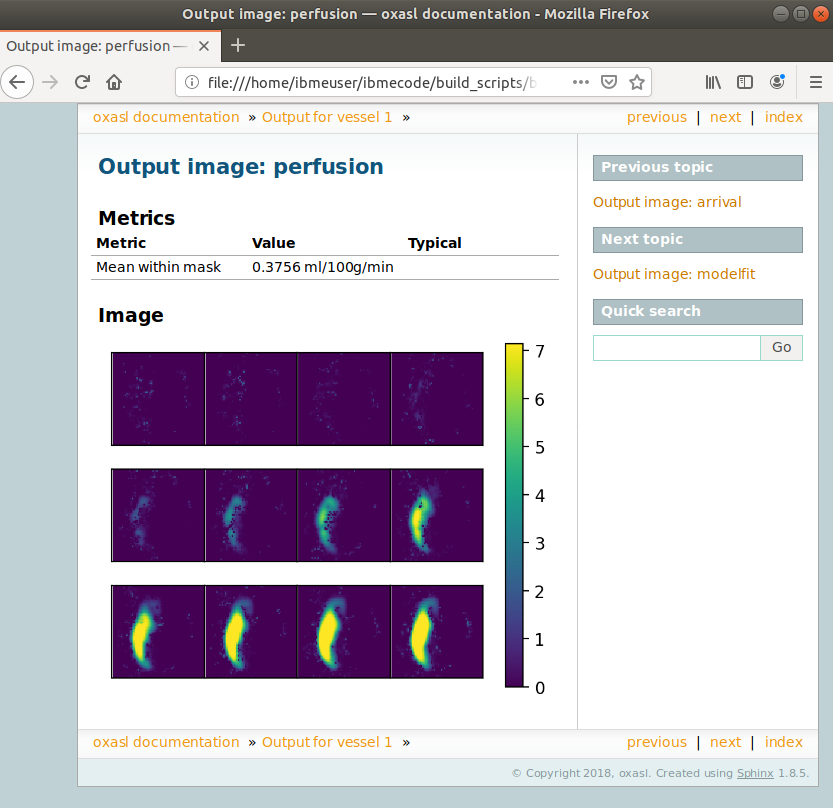
The usual OXASL output images are produced, for example:
perfusion.nii.gz- This is the relative perfusion imagearrival.nii.gz- This is the inferred bolus arrival time imageaCBV.nii.gz- This is the inferred macrovascular signal image containing arterial volume fraction as a percentagemask.nii.gz- This is the binary brain mask used in the analysis
Calibrated outputs are also produced if calibration data is supplied, and structural space outputs are also produced where structural data is available.
How all-vessel output images are combined
The combination of single-vessel data into all-vessel data is not completely trivial. The following methods are used:
- For perfusion and macrovascular signal data, the output of the individual vessels is summed
- For arrival time and variance/STD outputs, the combined output is a weighted average of the individual vessels, weighted by the relative perfusion contribution from each vessel in each voxel.
Summary report
The summary report will contain, alongside the usual information, separate output images for each vessel and the combined output images: